
Market Update | January 2025
Mortgage Rate Increase Throws Curveball Into Market
Published February 5, 2025 | Courtesy of NWMLS

Market Recap
Traditionally a quieter month in the winter season, January’s activity continued the year-over-year growth trends observed in market activity over the last twelve months. The number of closed sales increased by 10.8% year-over-year (3,727 in January 2025 compared to 3,364 in January 2024), and NWMLS brokers added 6,693 new listings to the database in January 2025, an increase of 35.1% compared to January 2024 (4,954).
“For-sale inventories are continuing to rise from historical lows, and that’s helping bring some life to housing market activity in the NWMLS area,” said Selma Hepp, chief economist at CoreLogic.
But questions still abound regarding one of the most critical aspects of today’s market – affordability – and the political and economic factors that influence it.
“Both prices and interest rates continued to increase, having a negative effect on affordability,” said Steven Bourassa, director of the Washington Center for Real Estate Research (WCRER) at the University of Washington. “The median price rose by nearly 4% to $615,000, while interest rates rose from 6.69% at the end of January 2024 to 6.95% now.”
“Moreover, new immigration policies are expected to have an inflationary impact on home construction costs,” he continued, “And the National Association of Home Builders has warned that tariffs on imports from Canada and Mexico would have a significant impact on materials such as lumber and gypsum, while multiple researchers have documented the possible impact of immigration policy on labor supply for home builders.”
“All of this suggests that the affordability of homeownership, which has been declining, will continue to do so,” said Bourassa.
January 2025 Key Takeaways
Active Inventory for Sale
The number of homes for sale increased 44.6% year-over-year throughout the NWMLS coverage area, with 22 out of 26 counties seeing a double-digit increase compared to January 2024. There were 10,241 active listings on the market at the end of January 2025, compared to 7,084 at the end of January 2024.
The five counties with the highest increases in active inventory for sale were Snohomish (+96.9%), King (+62.6%), Skagit (+54.4%), Kittitas (+53.8%) and Grant (+48.8%).
At the current rate of sales, there are less than three months (2.75) of available inventory.
Closed Sales
There were 3,727 closed sales of residential homes and condominium units in January 2025, an increase of 10.8% when compared to January 2024 (3,364).
The total dollar value of closed sales in January 2025 for residential homes was $2,471,486,679 and $377,558,816 for condominiums ($2,849,045,495 in total), an increase of 17.4% when compared to January 2024.
Median Sales Price
The median price for residential homes and condominiums increased by 3.6% year-over-year from $593,500 in January 2024 to $615,000 in January 2025.
The three counties with the highest median sale prices were San Juan ($850,000), King ($799,000), and Snohomish ($748,752), and the three counties with the lowest median sale prices were Ferry ($239,000), Okanogan ($318,000) and Grays Harbor ($329,000).
New Construction
NWMLS brokers reported 722 closed sales of new construction units in January 2025. This was a year-over-year increase of 17% when compared to January 2024 (617 units).
The median sales price for new construction homes sold in January 2025 was $760,500, an increase of 8.6% from the January 2024 price of $700,000.
Active Listings
There was a 44.6% increase in total number of properties listed for sale year-over-year, with 10,241 active listings on the market at the end of January 2025, compared to 7,084 at the end of January 2024. When compared to last month, active inventory increased by 717 listings (+7.5%), up from 9,524 in December 2024.
The number of homes for sale year-over-year increased throughout the NWMLS coverage area, with 22 out of 26 counties seeing a double-digit year-over-year increase. The counties with highest year-over-year increases in active inventory for sale were Snohomish (+96.9%), King (+62.6%), Skagit (+54.4%), Kittitas (+53.8%), Grant (+48.8%), and Island (+48.7%).

Year Over Year Active Listings
Island, King and Snohomish County

New Listings
NWMLS brokers added 6,693 new listings to the database in January 2025, an increase of 35.1% compared to January 2024 (4,954). When compared to last month (December 2024), new listings increased by 111.4%, when 3,166 listings were added to the NWMLS database.
The six counties with the largest increase in the number of new listings added to the NWMLS database last month were San Juan (+145.5%), Kittitas (+127%), Chelan (+102.6%), Lewis (+90.2%), Grant (+74.2%), and Island (+68.6%).

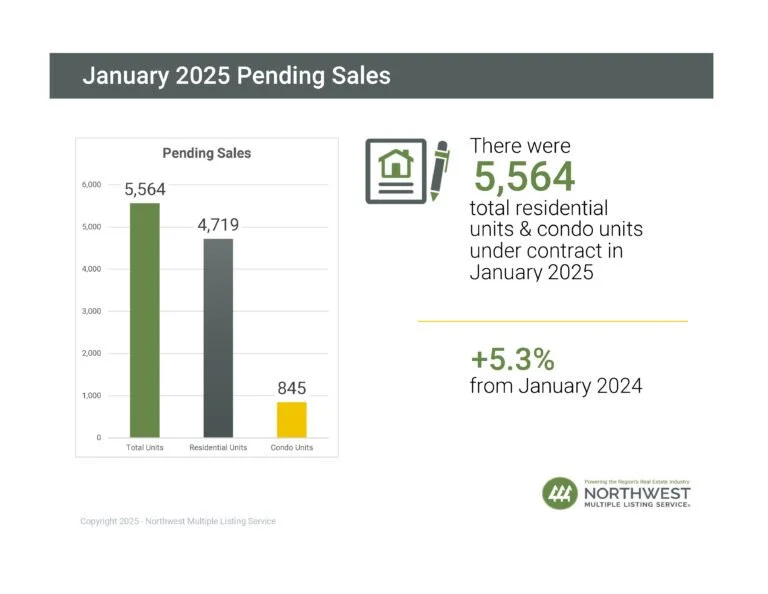
Pending Sales
There were 5,564 residential units & condo units under contract in January 2025, an increase of 5.3% when compared to January 2024 (5,282). When compared to last month, the number of pending listings increased by 29%, up from 4,312 listings under contract in December 2024.
19 out of 26 counties saw a year-over-year increase in the number of pending listings, with the highest year-over-year increases in San Juan (+80%), Walla Walla (+48.3%), Douglas (+31.3%), Chelan (+28%), Grant (+24%), and Lewis (+22.5%).
Closed Sales
The number of closed sales increased by 10.8% year-over-year (3,727 in January 2025 compared to 3,364 in January 2024). 18 out of 26 counites saw an increase in the number of closed sales year-over-year. The total dollar value of closed sales in January 2025 for residential homes was $2,471,486,679 and was $377,558,816 for condominiums ($2,849,045,495 in total), an increase of 17.4% when compared to January 2024.

Months of Inventory
A balanced market is considered to be 4 to 6 months by most industry experts. At the current rate of sales, it would take less than three months (2.75) to sell every home that is active in the NWMLS inventory. The five counties with the lowest months of inventory in January 2025 were Snohomish (1.69), Kitsap (2.14), Pierce (2.23), Thurston (2.37), and King (2.54).

Year Over Year Months of Inventory
Island, King, and Snohomish County

Median Price
Overall, the median price for residential homes and condominiums sold in January 2025 was $615,000, an increase of 3.6% when compared to January 2024 ($593,500). When compared to last month, the median price decreased by 1.7%, from $623,500 in December 2024.
The three counties with the highest median sale prices were San Juan ($850,000), King ($799,000), and Snohomish ($748,752), and the three counties with the lowest median sale prices were Ferry ($239,000), Okanogan ($318,000), and Grays Harbor ($329,000).
